The Lantern Bay portfolio: a fictional fleet built from public archetypes
Foundation Case L Asset dossiers
On this page
- Meet Lantern Bay Renewables: six fictional assets, each standing for a kind of project you can read about in the trade press
- Learn the dossier method: how an asset manager or trading analyst researches a real asset from public sources before an interview or an acquisition
- See the first result: two neighbouring wind farms with the same weather should answer a negative price in opposite ways, because of their contracts
Fictional by design
Lantern Bay Renewables, its assets, buyers and contract terms do not exist. Each
asset is an archetype of a public project type, with rounded sizes, equipment
described by class and buyers by type. Every price and term is illustrative, and
the generation and price data are synthetic and seeded (energy_or.data.portfolio).
Nothing here comes from a confidential source.
Why a fictional portfolio?
The flagship cases so far each isolate one decision: one shared connection, one battery, one maintenance campaign. Real asset managers look after a fleet: different technologies, regions, contracts and life stages, sharing staff, spares, cranes, hedges and lenders. Case L needs such a fleet. It also has to be realistic enough to argue about and open enough to publish. So we build one from the patterns that public projects follow, and give each asset a name that belongs to no real project.
The fleet
| Asset | Region | Technology | Size | Equipment class | COD | Offtake (illustrative) |
|---|---|---|---|---|---|---|
| Saltbush Plains Wind | VIC1 | wind | 210 MW, 50 turbines | 4.2 MW-class, 136 m rotor | 2025 | State-backed contract for difference on 75 % of output, strike $72, suspended below $0, certificates to the state; 15 years |
| Quandong Ridge Wind | VIC1 | wind | 100 MW, 24 turbines | 4.2 MW-class, 136 m rotor | 2025 | Data-centre owner buys 95 % as produced at $68 with certificates; 12 years |
| Ironbark Gully Wind | NSW1 | wind | 60 MW, 16 turbines | 3.75 MW-class, 126 m rotor | 2024 | Telco buys 80 % as produced at $70 with certificates; 15 years |
| Mallee Glow Hybrid | WEM | solar + battery | 100 MWac / 128 MWp + 55 MW / 220 MWh, DC-coupled | single-axis trackers | 2025 | Merchant energy and certificates + reserve capacity credits for 50 MW |
| Riverbend Sun Solar | NSW1 | solar | 200 MWac / 260 MWp | bifacial, single-axis trackers | 2026 | Telco buys 50 % as produced at $55 with certificates; 15 years |
| Wattlebird Bay Hybrid | QLD1 | solar + battery | 290 MWac / 330 MWp + 180 MW / 360 MWh | trackers + 2-hour battery | 2028 | Retailer buys an evening block: 80 MW, 17:00–21:00, at $230 (a swap the battery must help deliver); 10 years |
Saltbush Plains and Quandong Ridge share one 132 kV line to the transmission network: the public-archetype cousin of Case A.
The dossier method: researching a real asset from public sources
Before an interview, a due-diligence call or a trading role, you can learn most of what matters about a real asset without a single confidential document. A dossier answers eight questions, each from a public source type.
| Question | Where to look |
|---|---|
| Where is it, how big, since when? | Owner and developer releases; the market operator's generation information and registration lists; planning approvals |
| What equipment? | Planning documents (turbine count, tip height, module and tracker type); OEM and EPC press releases |
| Who maintains it, and on what terms? | OEM service-agreement announcements (often 10–25-year full-service with an availability guarantee) |
| Who buys the output, and how? | Offtaker releases (corporate PPAs), government auction results (contracts for difference), trade press |
| How is it connected, and what are its losses? | Network operator project pages; the annual marginal loss factor report |
| How does it actually run? | Public 5-minute unit output, bids and prices from the market operator, which show capacity factor, curtailment and negative-price behaviour |
| How does it bid? | Public bids (published with a one-day lag): ten price bands, rebids, the floor it protects |
| Who owns and finances it? | Annual reports, lender and law-firm releases, sale-process news |
Rules that keep a dossier honest: - Cite every fact with a link and a date. - Mark every inference as an inference. - Keep conflicting sources visible: nameplate and registered capacity often differ, and a "260 MW" solar farm may be DC or AC.
The book's later chapters turn the last three rows into models: - capacity factor and curtailment from public output; - bid-band strategy from public offers; - inverse optimisation: inferring from the floor an asset defends what its contract must look like.
One synthetic year
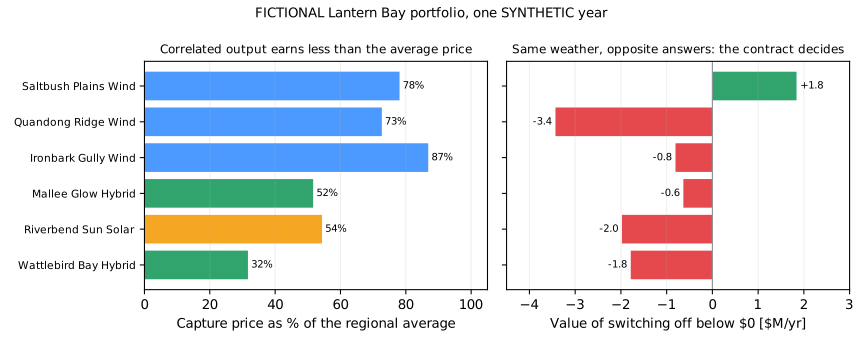
| Asset | Capacity factor | Generation [GWh] | Capture price (% of regional average) | Revenue, all streams |
|---|---|---|---|---|
| Saltbush Plains Wind | 36.0 % | 663 | $66 (78 %) | $41.0M |
| Quandong Ridge Wind | 37.7 % | 330 | $61 (73 %) | $22.8M |
| Ironbark Gully Wind | 32.0 % | 168 | $86 (87 %) | $13.2M |
| Mallee Glow Hybrid | 29.1 % (solar side) | 255 | $35 (52 %) | $26.4M |
| Riverbend Sun Solar | 26.1 % | 457 | $54 (54 %) | $31.0M |
| Wattlebird Bay Hybrid | 27.0 % (solar side) | 686 | $27 (32 %) | $37.7M |
Two patterns are already visible:
- Cannibalisation. Every asset earns less than the average price, because it produces most when everyone like it produces most. Solar in a sunny region suffers most: the Queensland hybrid's solar side captures only 32 % of the average price. That is exactly why it has a battery and an evening contract.
- The contract decides the bid. Saltbush Plains and Quandong Ridge sit next to each other, see the same wind and share a line. Yet switching off whenever the price is negative is worth +$1.8M a year to Saltbush, whose contract for difference is suspended below $0. It costs Quandong $3.4M, because its buyer stops paying for energy it does not produce. Every other asset loses money by switching off at $0, because a certificate is worth about $30/MWh to whoever keeps it. The right floor is minus what each MWh earns outside the energy market. Chapter 6 derived this for two farms; here it falls out of six real-world contract shapes.
What comes next
The portfolio feeds: - Case H, public version: the shared 132 kV line between a contract-for-difference farm and a data-centre PPA farm (Chapter 12). - Case L, risk: the distribution of a year's revenue, VaR and CVaR, and which assets and drivers cause the bad years (Chapter 13); then what to sell forward and how much (Chapter 14). - Fleet optimisation (Milestone 8): crews, cranes and spares across three wind farms and three solar plants. - Life cycle: each asset's warranty, degradation and augmentation, as in Chapters 10–11.
| Artefact | Location |
|---|---|
| Fleet, contracts, synthetic year, settlement | src/energy_or/data/portfolio.py |
| Tests | tests/test_portfolio.py |